Hi, I'm Edyta, Product Designer

I build products end-to-end
with AI and eyes on real people.

B2B
B2C
SaaS
8+ years exp
AI-oriented
Product Strategy, User Research, Design Systems, Prototyping, Discovery & Delivery, B2B SaaS, End-to-End, Visual Craft, UI, UX, AI

Selected case study

Localo · Report Builder

Localo · Report Builder

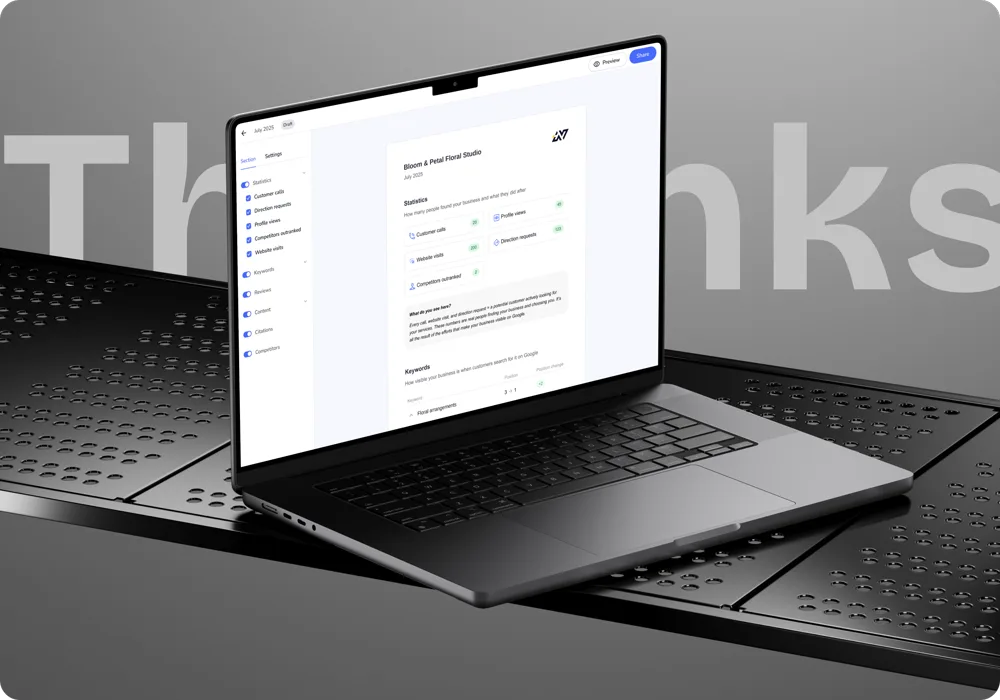
Agencies used to piece client reports together from screenshots, several hours a month. Today 60% of report users generate and send them automatically.
Product Design
B2B2C
SaaS
UX Strategy
Codete · Four B2B products

Codete · Four B2B products

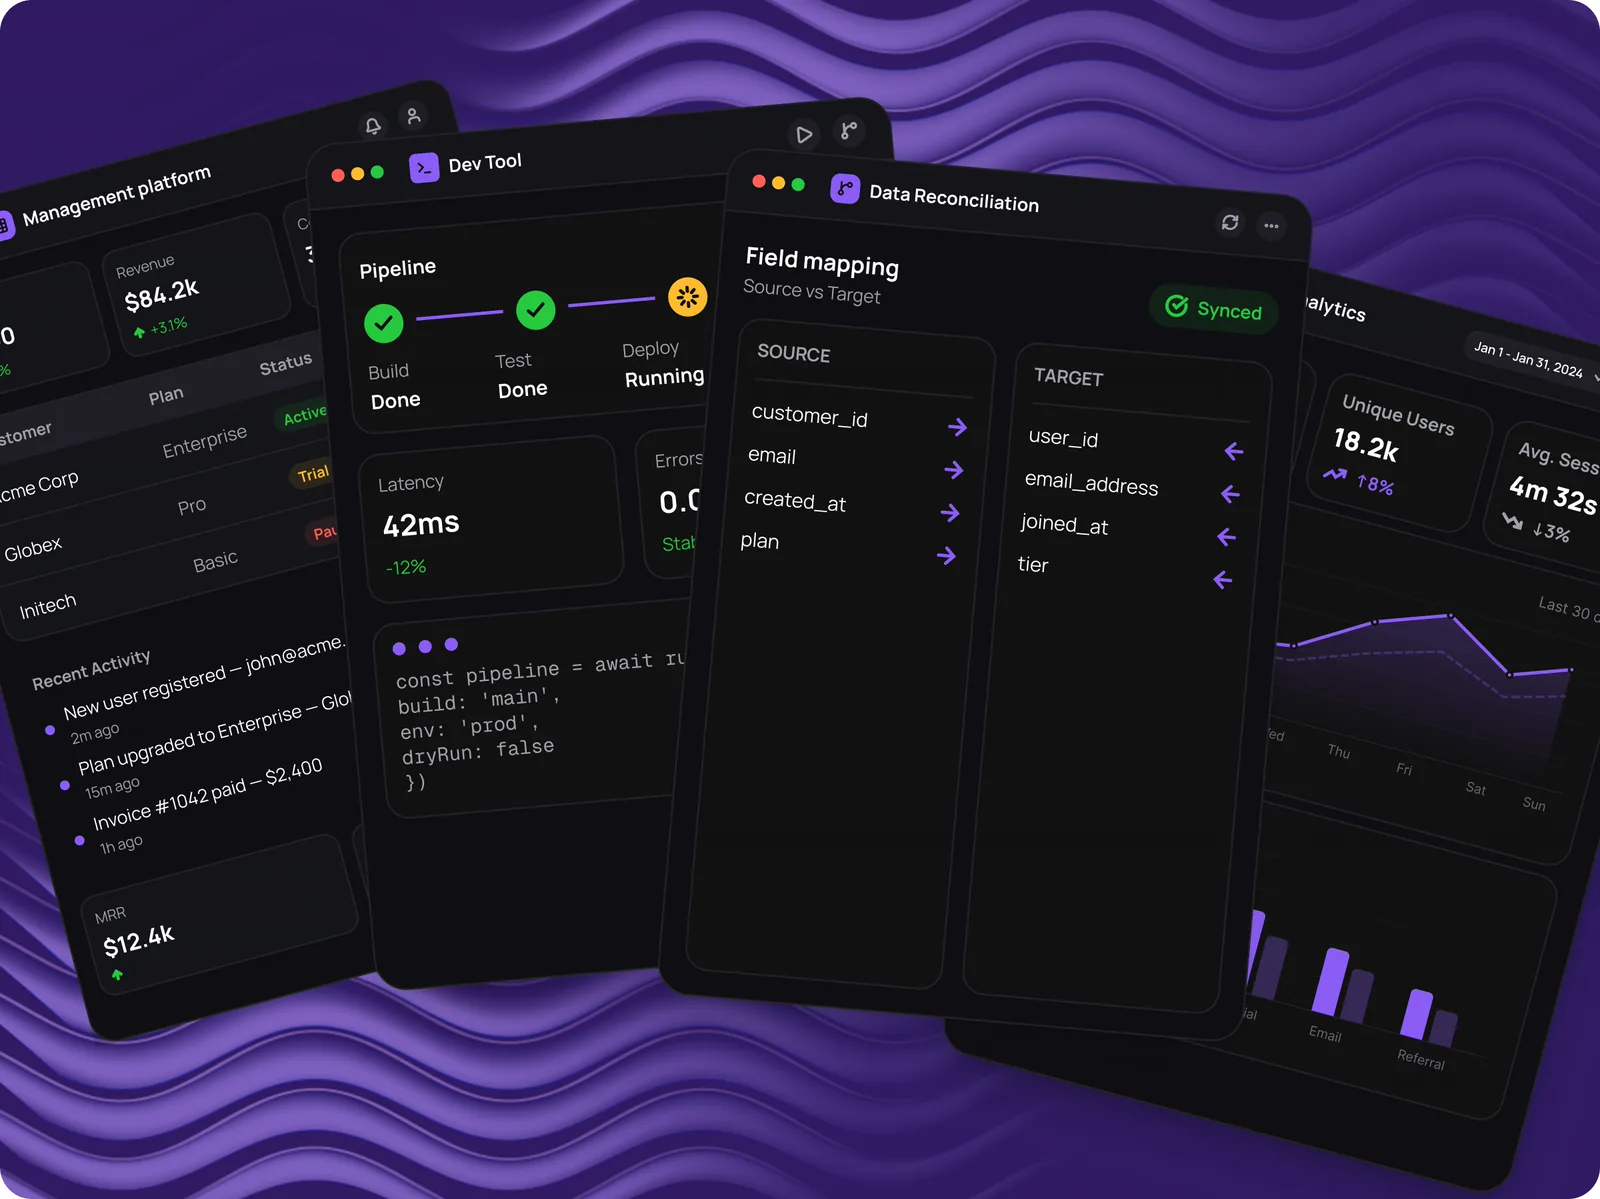
An internal enterprise platform, a tool for contracts and data reconciliation, a developer tool and an analytics platform at MVP. All four needed a design system built from scratch.
0→1 Design
Enterprise B2B
Design System
NDA
Localo · Client Acquisition

Localo · Client Acquisition

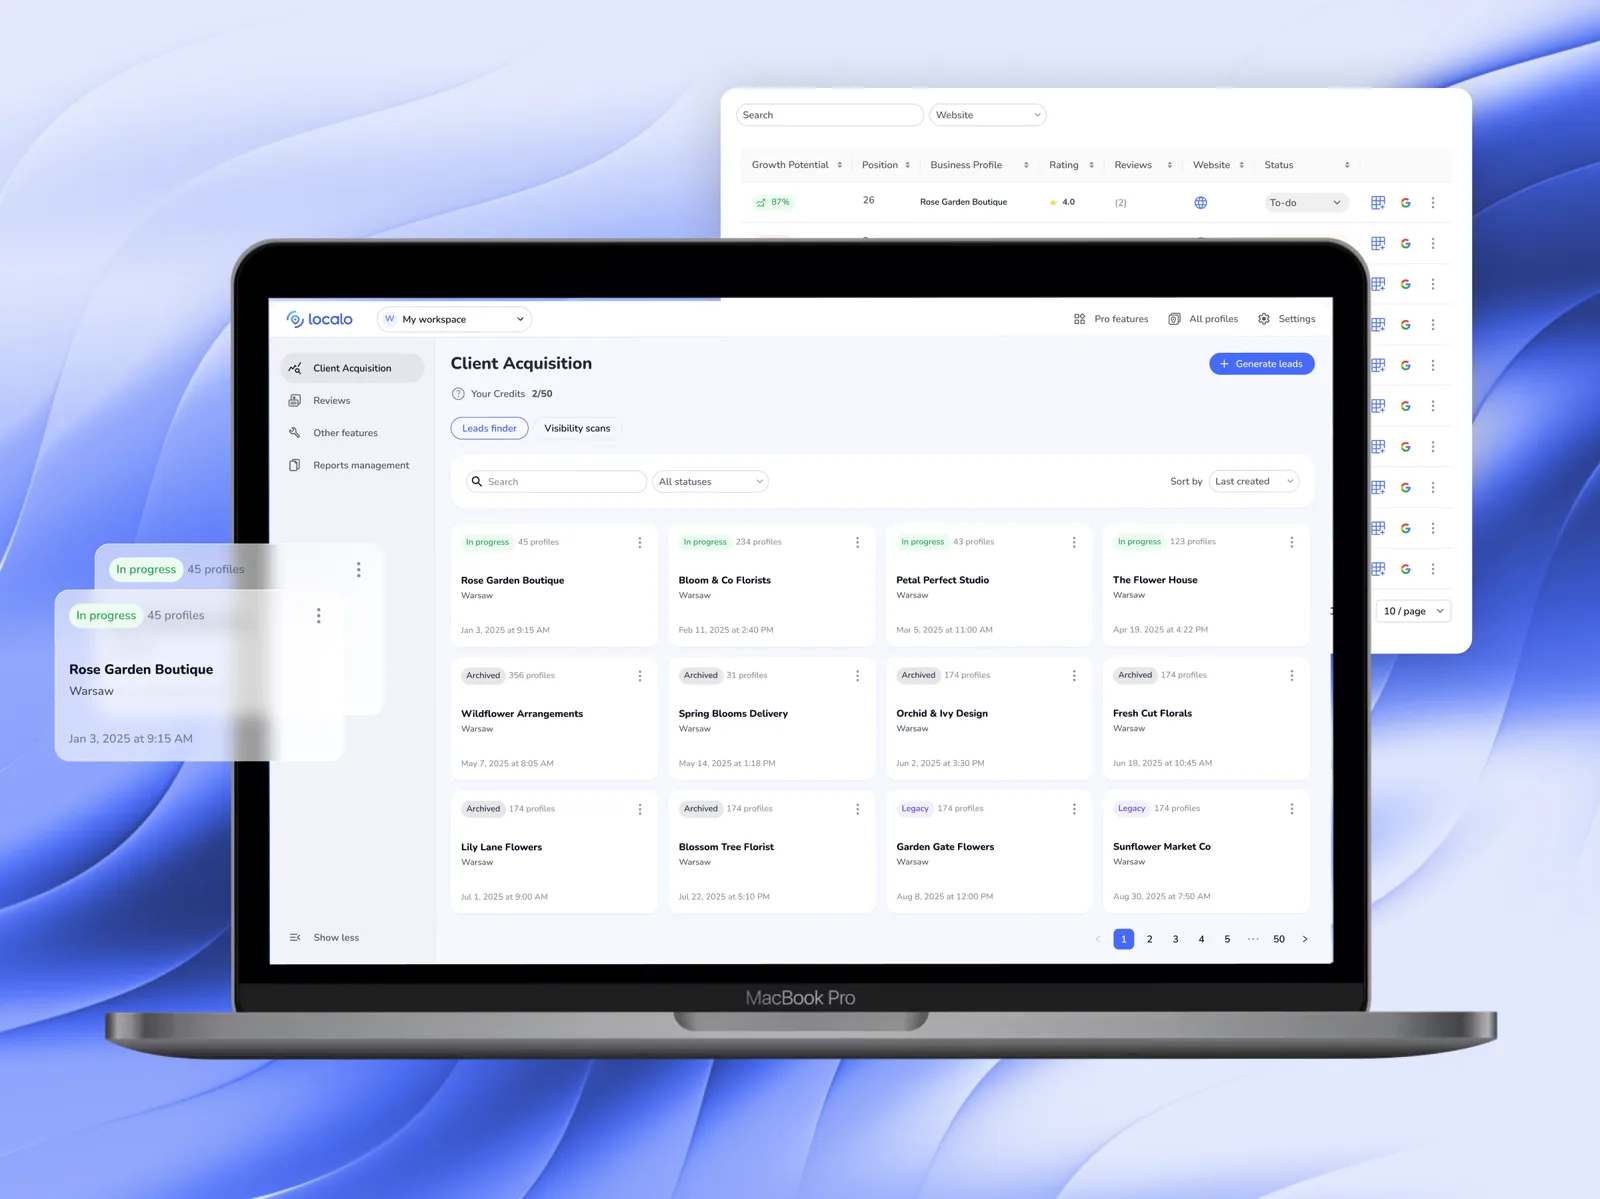
Almost nobody switched the feature on themselves — its value only landed on a call with Customer Success. After the redesign, sessions on the feature grew 2.5× and median time on it rose 81%.

Redesign
B2B2C
SaaS
Workflow Optimization

Side projects

PlanujemyTo

PlanujemyTo

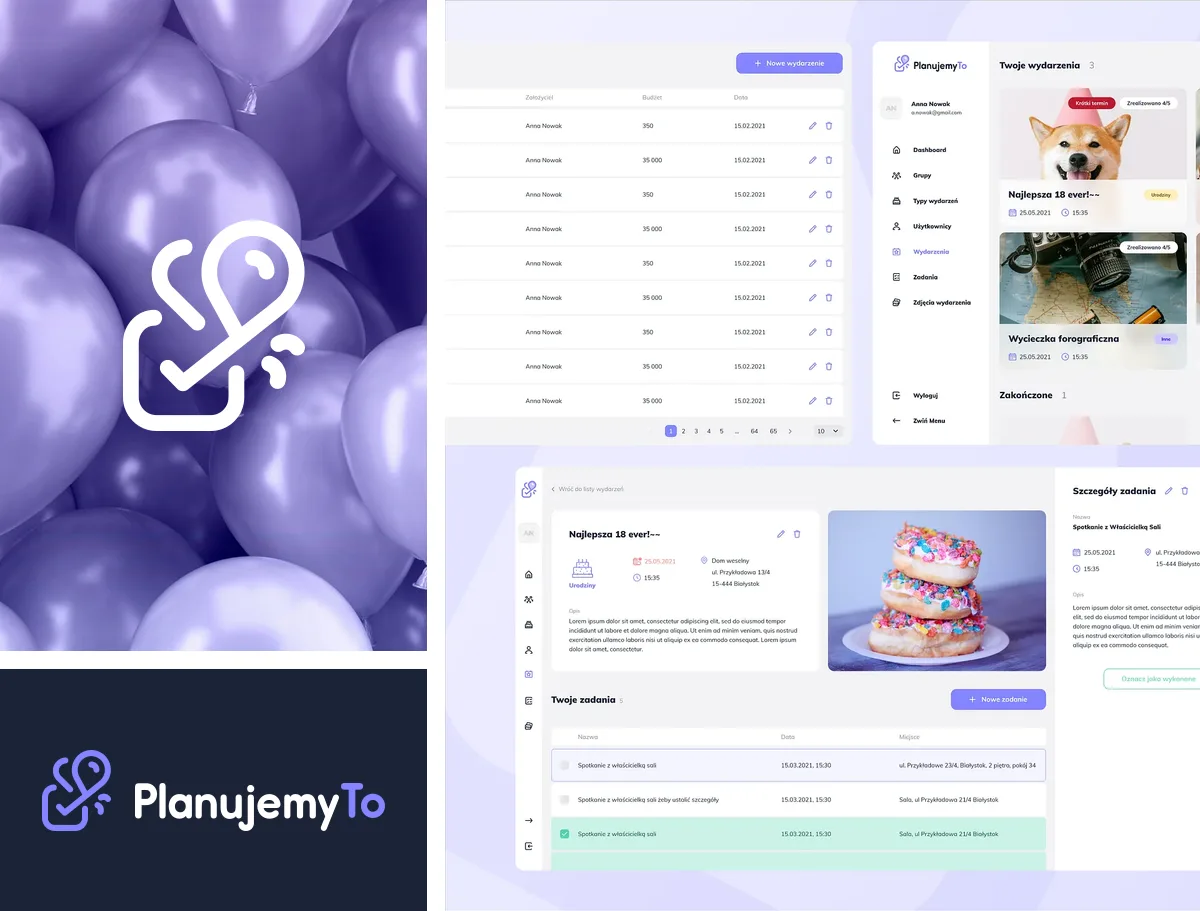
Free event-planning app — brand, product and design system.
0→1 Design
Brand Identity
Design System
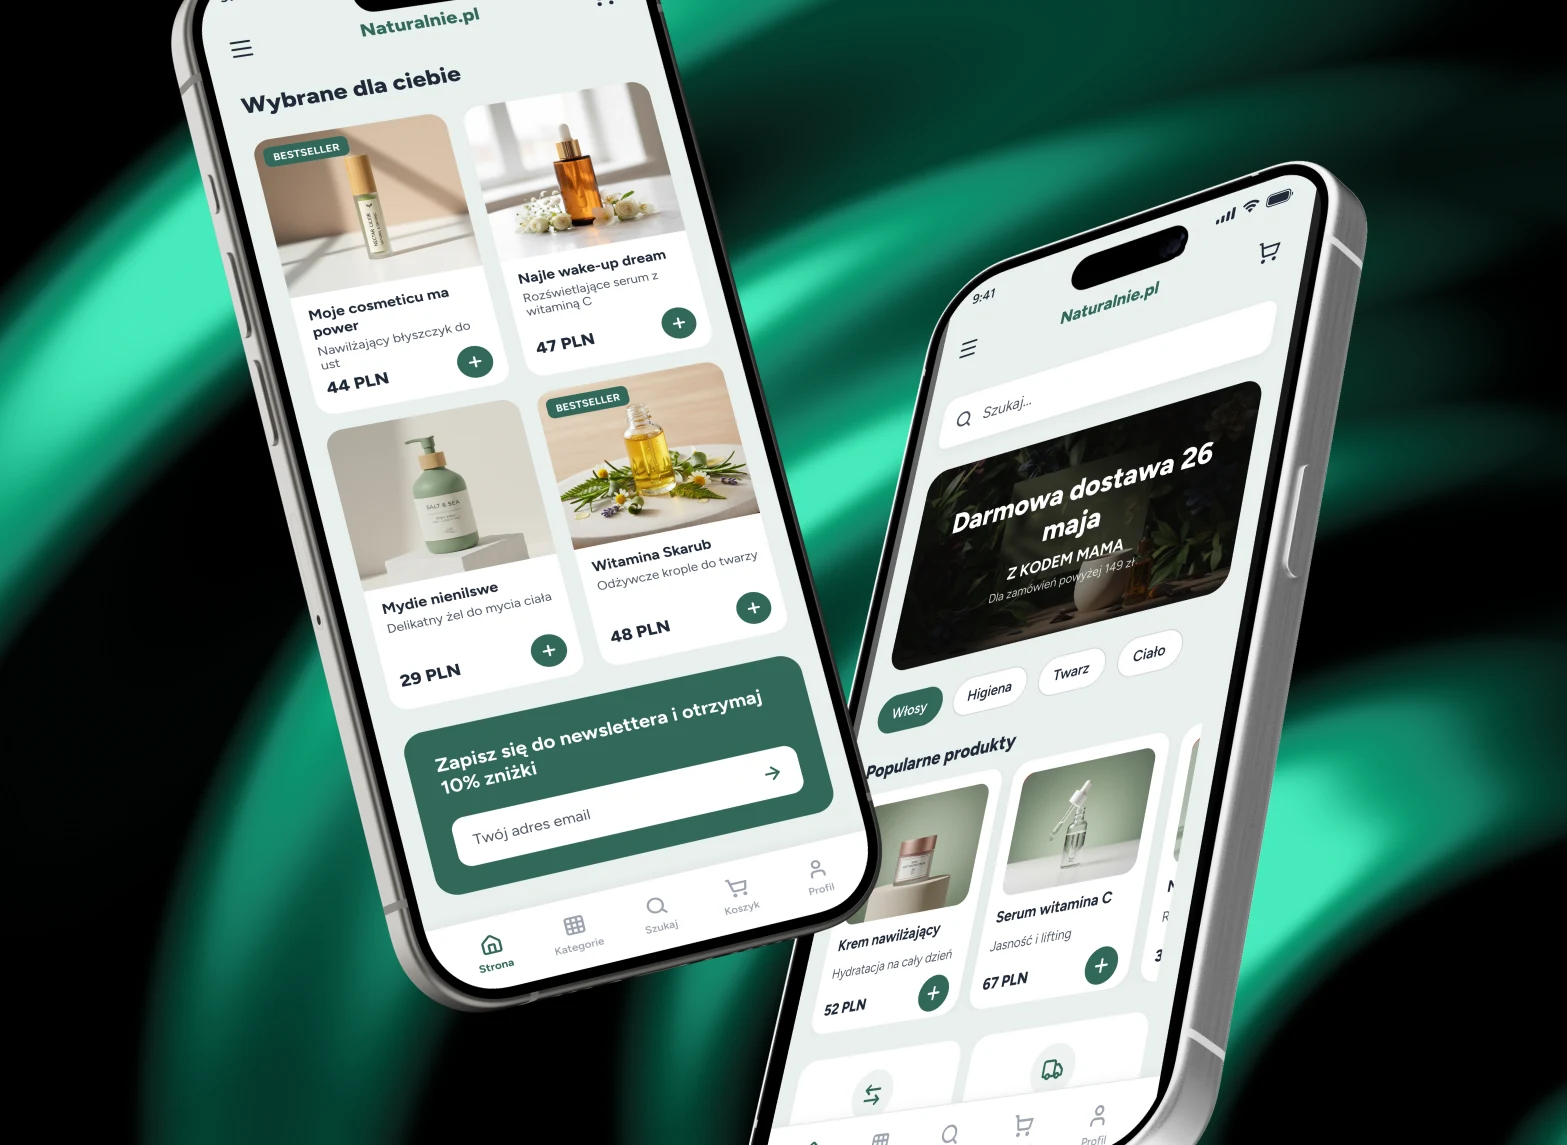
Naturalnie.pl

Naturalnie.pl

Mobile UI concept for a natural cosmetics and personal care online store.
Redesign
E-commerce
Mobile Design
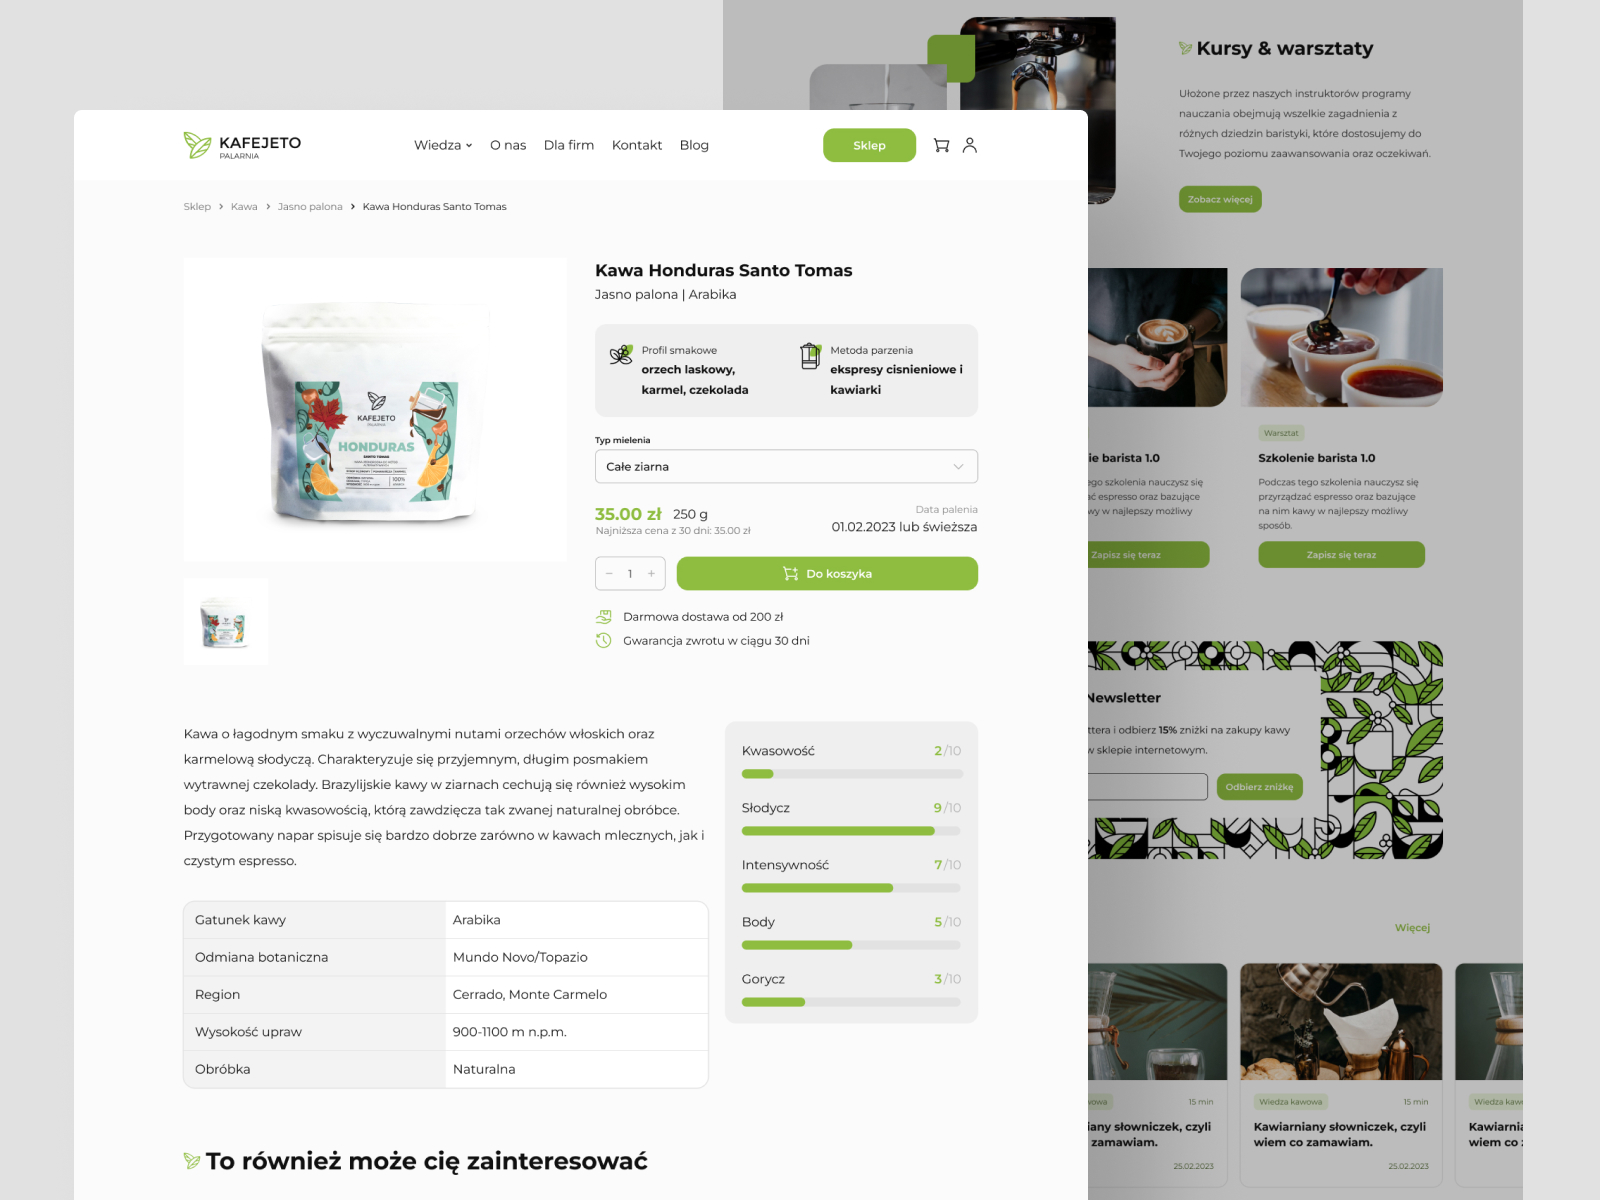
Kafejeto.pl

Kafejeto.pl

Online store for a Polish specialty coffee roastery — fresh coffee, accessories, training.
UI Design
E-commerce
Responsive Web
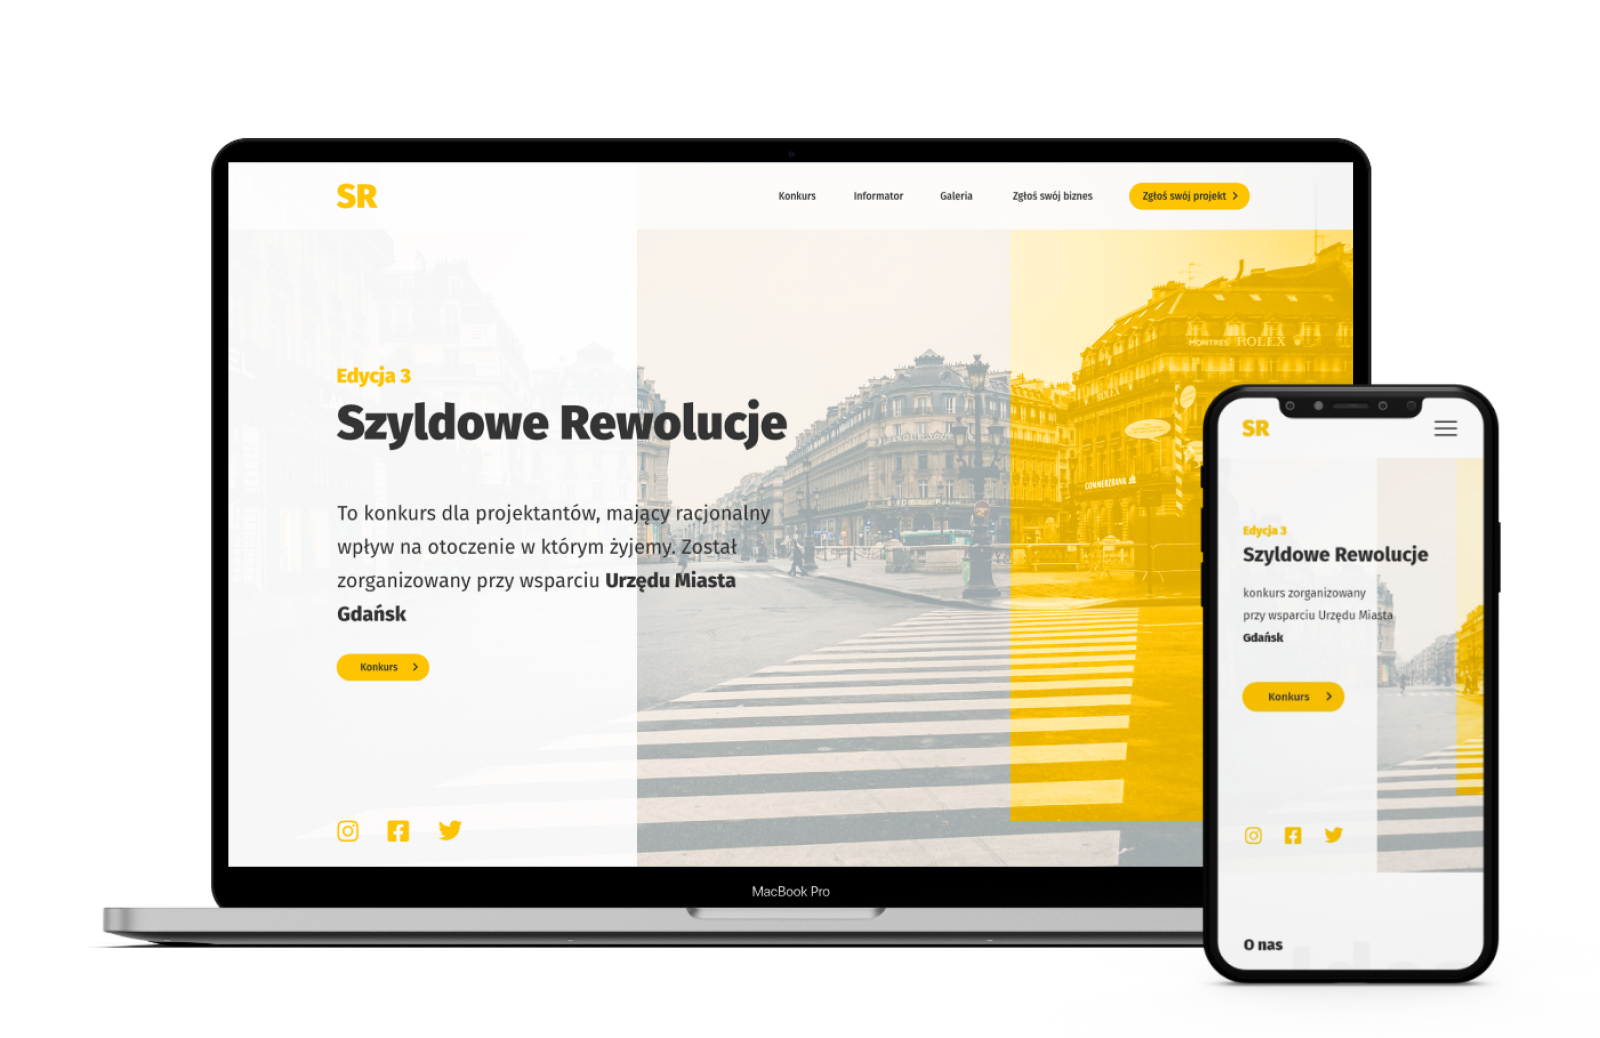
Banner Revolution

Banner Revolution

Competition website for designers fighting advertising chaos in urban space.

0→1 Design
Non-profit
UX Research

Let's talk

Want to talk about a project, learn more about the process, decisions, and context? Find me on LinkedIn or just send an email : )

CASE STUDY · LOCALO

Automatic report builder

Product Design
B2B2C
SaaS
UX Strategy

I disproved the first hypothesis, ran the research and built a new one out of it. Instead of letting the agency's client into Localo, I designed a report that generates and sends itself with one click. Today 60% of report users rely on auto-generation instead of doing it by hand.

MY ROLESenior Product Designer
PRODUCTLocalo
SCALE6,700+ users
ADOPTION11–13%
Automatic report builder
01 · CONTEXT

The CEO came in with a ready-made solution.

The CEO's proposal answered that directly: let users invite their clients into Localo. The agency's client logs in and checks the data, specialists stop wasting time on reporting. If the problem is assembling the report by hand, remove the report from the equation and let the client into the tool.

PROBLEM

SEO specialists have to regularly prove to clients that their work is paying off. They put these summaries together by hand, separately per profile, a few hours every month. The client is non-technical and has never logged into our tool before.

02 · DISCOVERY

Research - plenty of questions, few answers

I convinced the CEO that this was the moment to invest time in deepening the problem: two or three months of work on a wrongly framed diagnosis costs the company far more than a sprint of extra research.

8In-depth interviews
100+Survey responses
3Customer success sessions

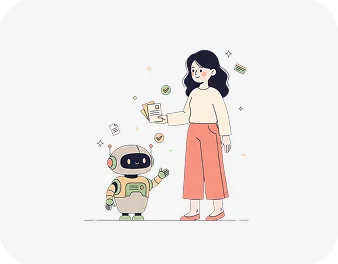
I combined the research findings into one coherent picture using AI to speed up this stage of the work. Claude analysed the quantitative and qualitative research materials and the meeting transcripts for me.

Key findings

01Reports are scanned

The end client runs their own business and doesn't sit down to analyse numbers. They skim the report.

02Assembling a report is hours, every month

They collected data from several tools and put it together by hand into one presentation.

03Need for client education

Reports often came with separate explanations: what the data is and why it matters to the client.

Our clients' clients - the persona

Reports have two audiences. The specialist creates the report and uses it to show the client the work is paying off. The end client only scans it. So I was also designing for someone who isn't a user of our product.

Who they are

A non-technical business owner. Doesn't know SEO and doesn't have a Localo account.

What they want

Two answers: "is it getting better" and "what's in it for me".

How they read

Skims the report visually. Has neither the time, the skill, nor the will to analyse numbers and charts.


03 · RE-FRAMING

Change of direction

The hypothesis we started with didn't hold up in research. The problem wasn't access to the data — it was the effort and commitment that entering the tool would demand from the client. That flipped the direction: instead of letting the client into Localo, we had to push the report out to them. I presented the CEO with the research findings, the framed problem and the new hypothesis. He accepted them without resistance — the data was unambiguous. We agreed on the project's goal together.

Starting hypothesisRejected

Give the client read-only access to the tool, and they'll check their own data. The problem wasn't access, it was the effort and commitment.

The real hypothesisNew!

If the report builds itself and reaches the client, specialists will switch to auto-reporting and stop creating reports manually.

Test: what share of report users turns on automation, and how many never generate manually at all.
GOAL

Build a tool for automatic reporting that clearly shows results to non-technical clients and builds trust in the collaboration.

04 · SOLUTION

What I built

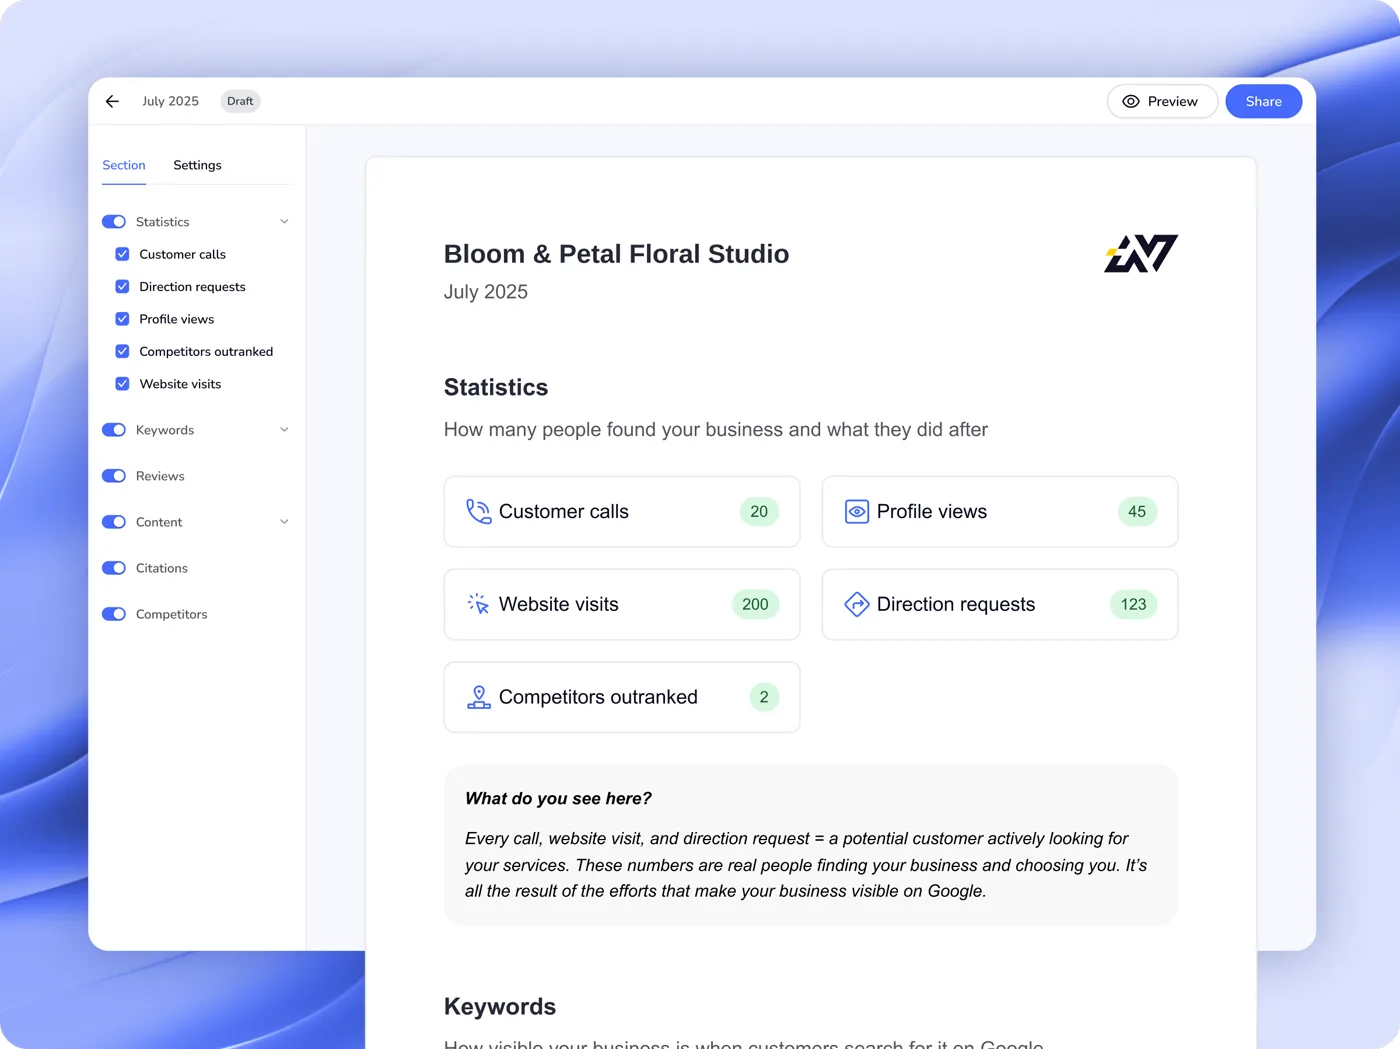
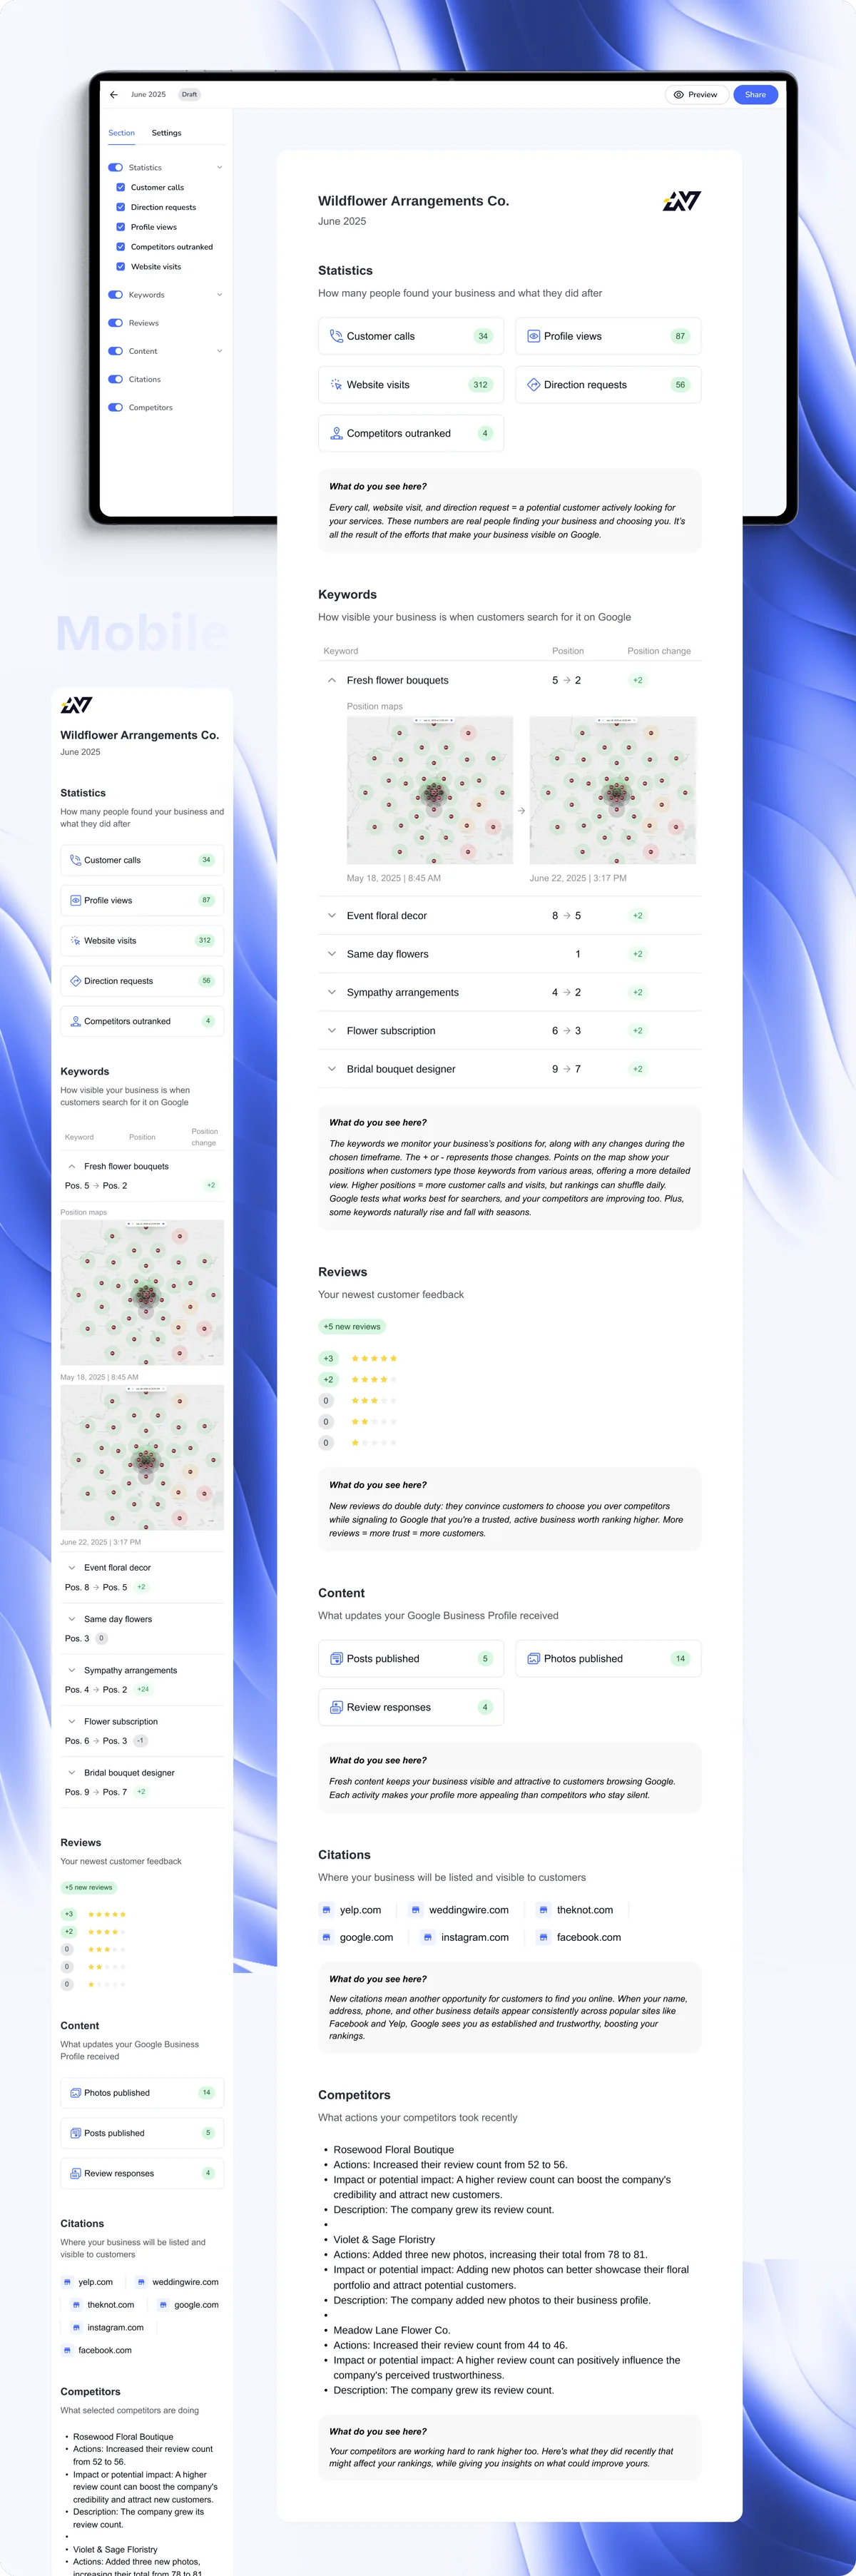
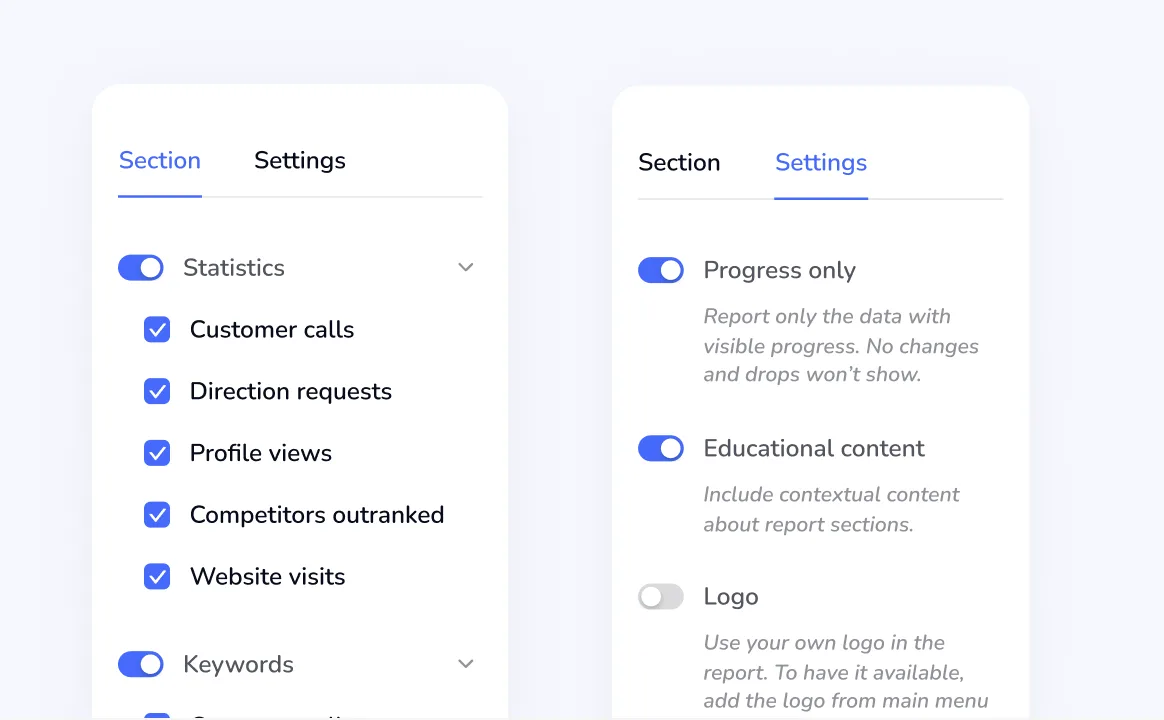
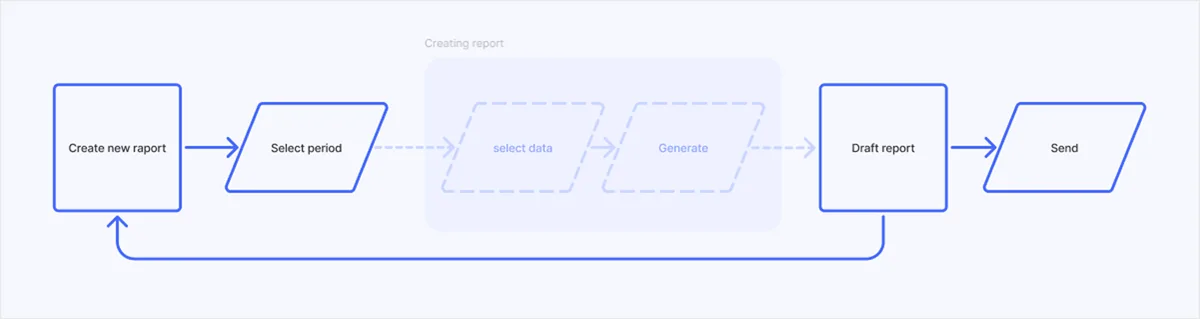
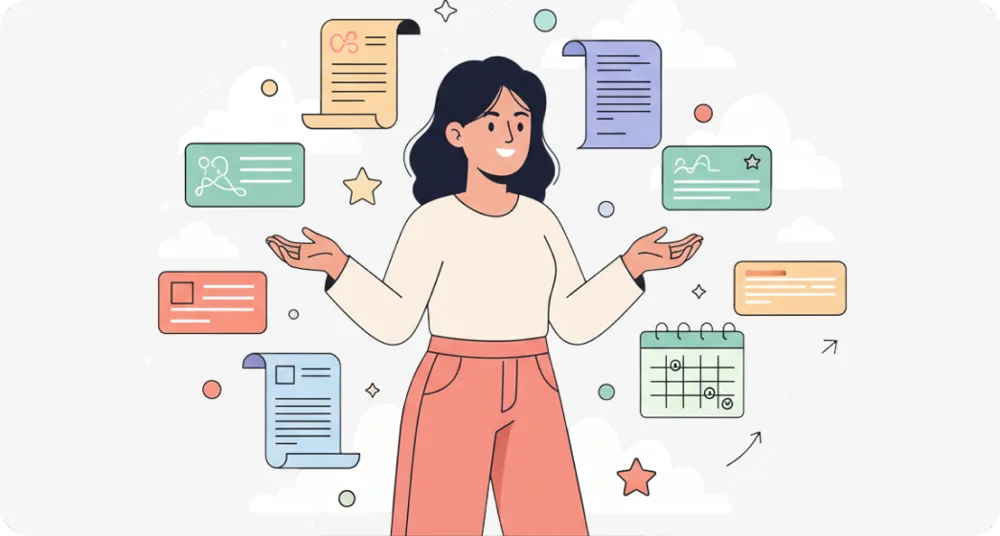
Reporting and auto-reporting. The user sets – globally or separately per profile – how often a report should generate. They get a ready document with the profile's key information: keyword rankings and their changes, profile activity, reviews. They can turn individual sections on and off, depending on what their clients need.

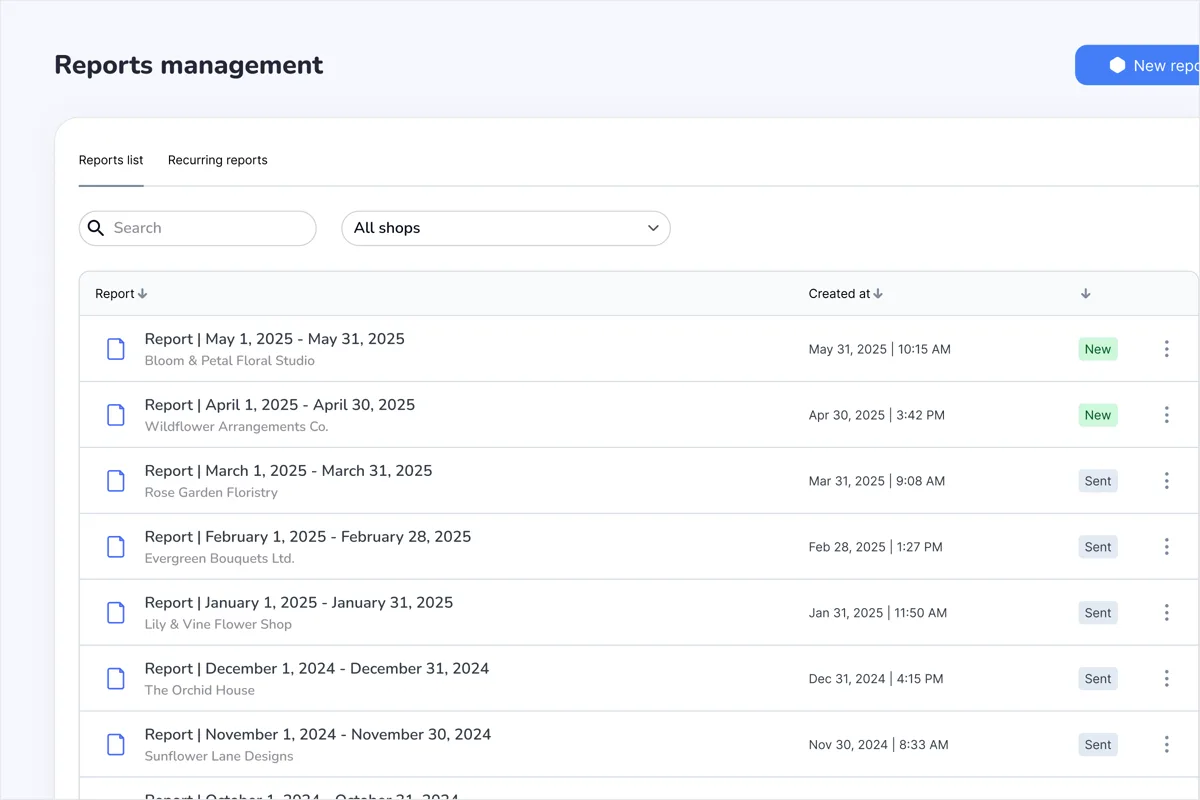
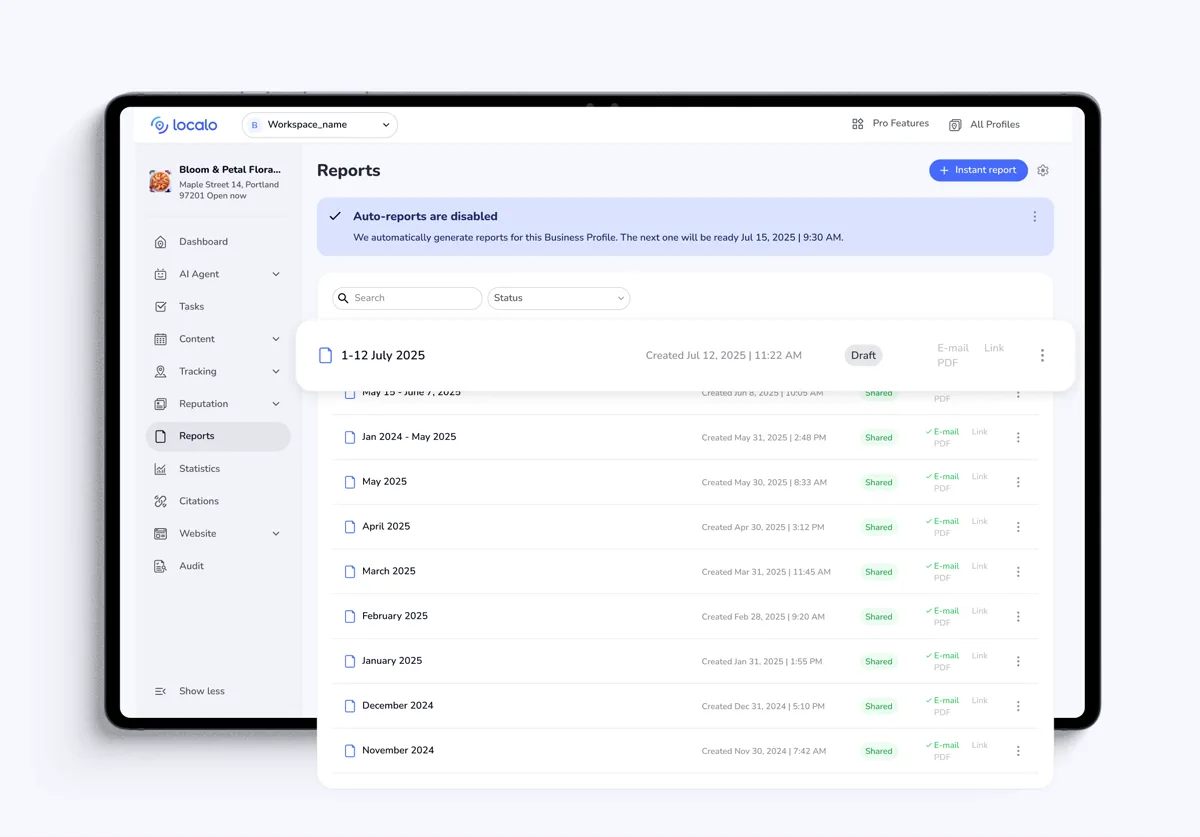
Reports list – one profile's history

The user doesn't start from an empty builder. They open the profile, and the draft for the current period is already there – just review and send.

The report

The report starts complete – stats, keywords with rank maps, reviews, content, citations and competitors. Everything for the period, nothing to pick manually. The agency logo at the top, and a short explanation next to each metric.

The report
I tailor it to this specific client

Unchecks whatever they didn't work on this month. The report should answer 'is it getting better', not show everything the system can count.

Auto-reporting
Auto-reporting

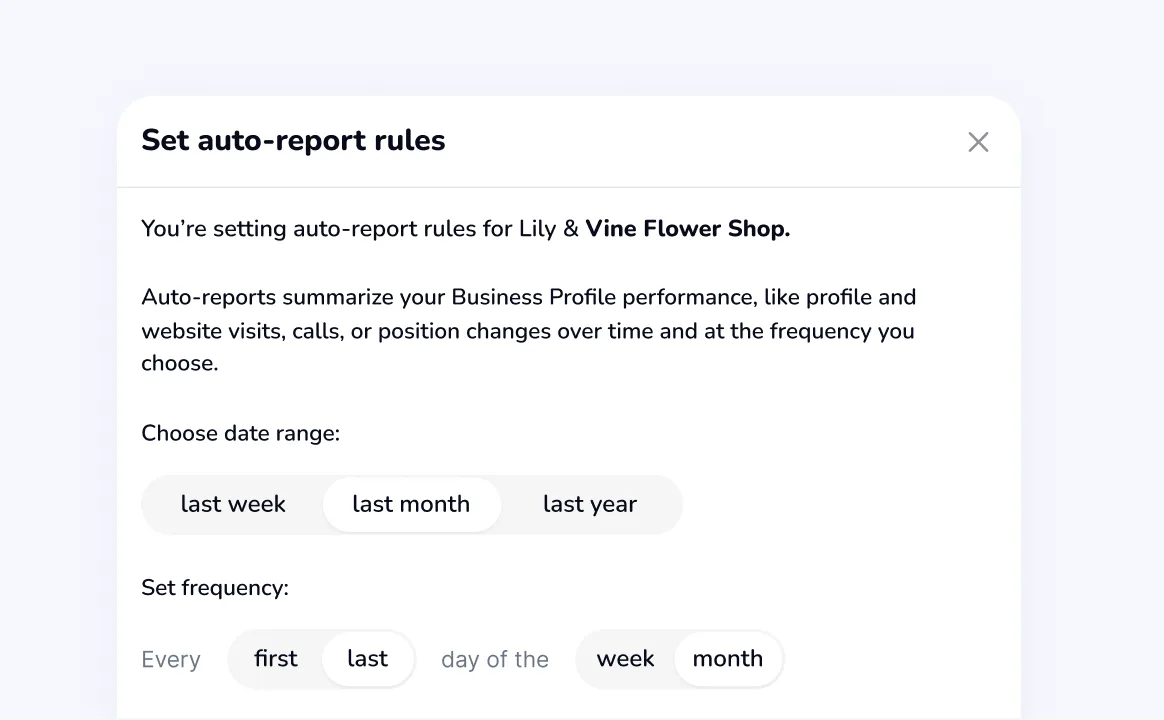
Auto-reports are on by default. The data range – e.g. a month – and generation frequency can be edited anytime.

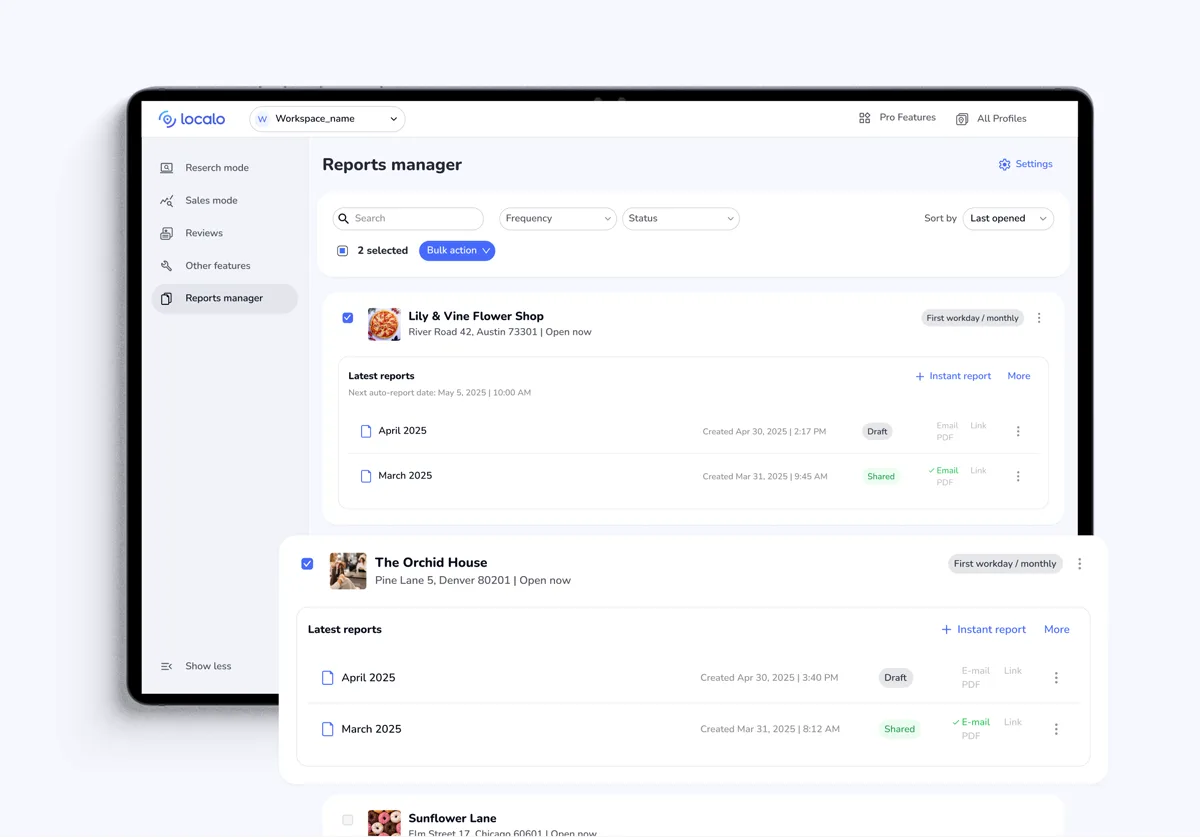
Manager – a list of profiles, not a list of reports

Manager – a list of profiles, not a list of reports
The bird's-eye view

Anyone managing a dozen-plus profiles needs a view of their whole client portfolio. This layout came after usability testing: client first, their report second.

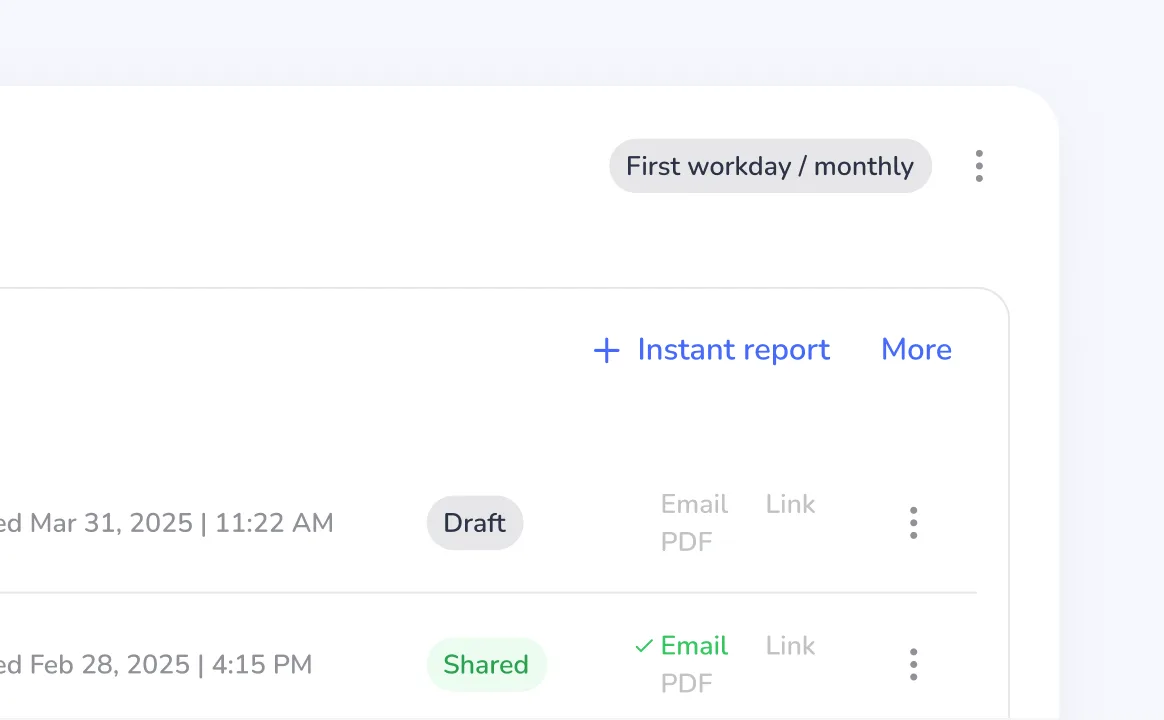
Statuses and schedule

Sees what went to the client and when the next report will generate. Without opening every profile individually.

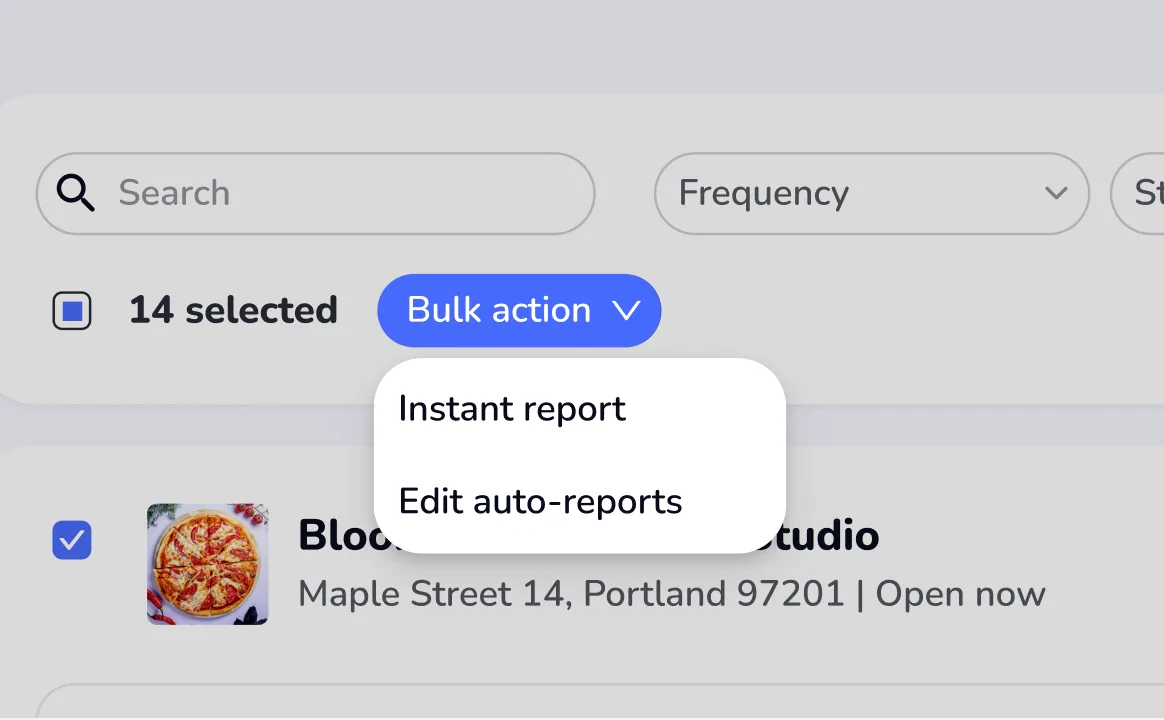
Multiple reports at once

If they need a report outside the fixed schedule, a bulk action handles it.

Delivery
Delivery

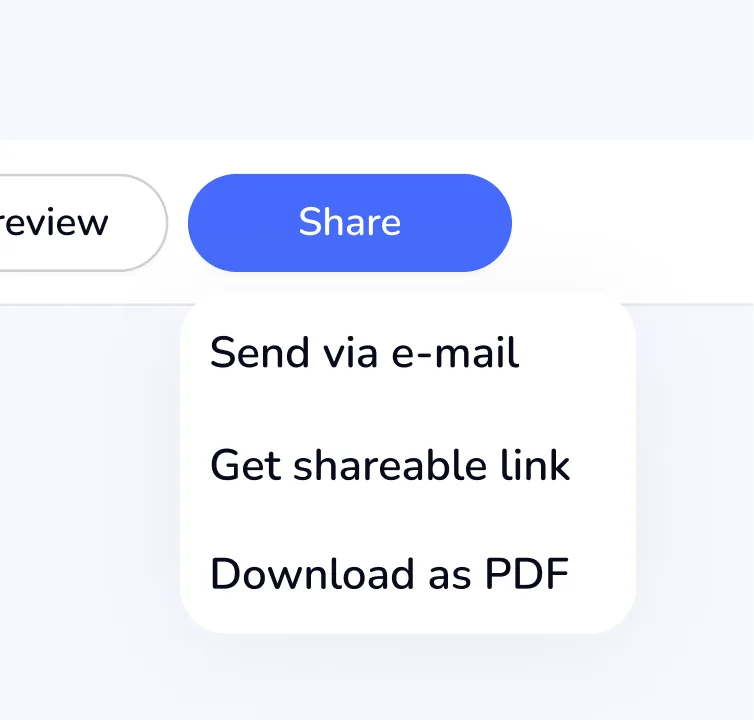
Three ways from one screen: auto-send, a login-free link, or a PDF.

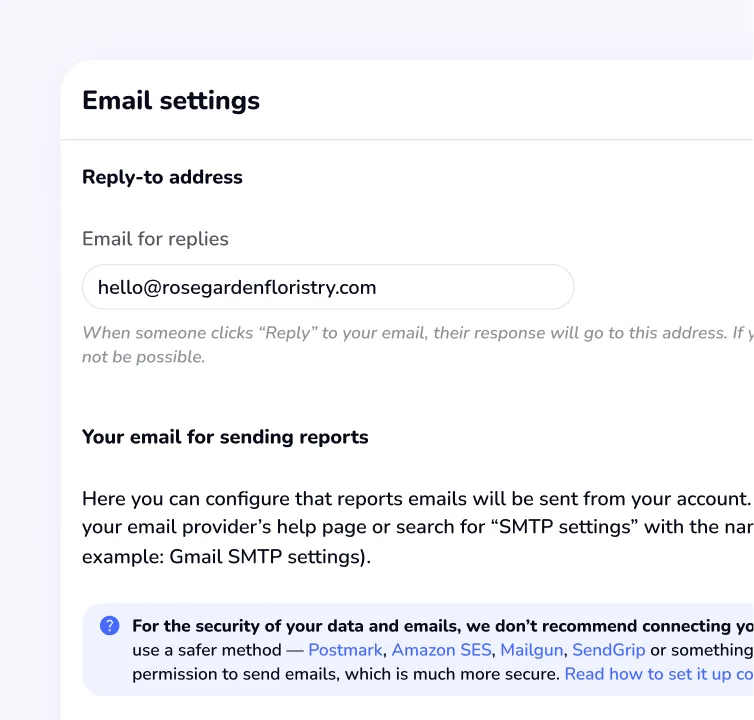
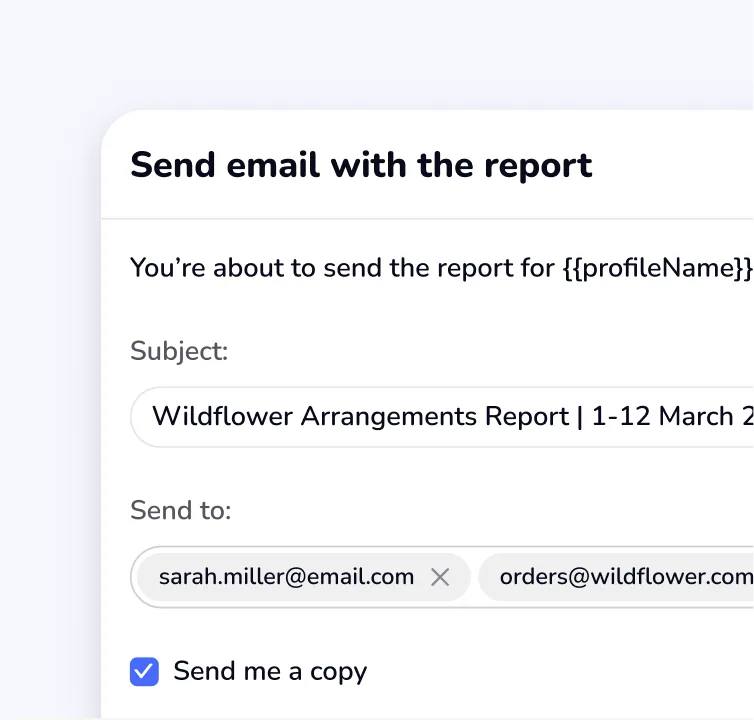
Sending by email
Sending by email

The report goes to the client – the client doesn't go to the report.

Sending by email
Sending by email

The report goes to the client – the client doesn't go to the report.


05 · Design decisions

Key decisions

The report is generated from the full dataset, selection happens before sending
  • every new report generates a rank map, and that costs money,
  • selecting before generation meant the user would produce a new report every time they changed their mind.
The builder as an assistant, not an empty form

The report generates itself, and the user gets a ready draft. The automation prepares, but it doesn't decide for them.

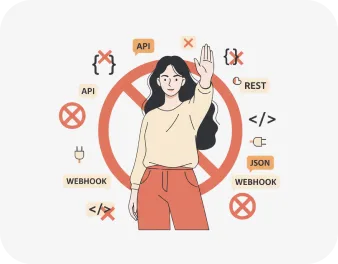
We didn't build an API

At this stage the effort was disproportionate to the payoff. We logged the idea in the backlog.

Changes after usability testing

Changes after usability testing
The list was organised the opposite way from how users work.

The manager showed every report generated for every profile. Users got lost in that list and had trouble navigating.

Report history wasn't useful.

Respondents were looking for one thing: whether the latest report is still a draft, or has already gone to the client.

Interactive maps lost to infrastructure

Reports sent by email were meant to include interactive rank maps – clicking a map would open a link. Email clients, however, filtered the test messages as spam. We didn't have enough time to work around it, so we cut the maps from emailed reports. The good news is that we found out, not the users.


06 · RESULTS & PROOF

A habit change

One in nine report users stopped doing by hand something they had always done by hand. Auto is the dominant mode here, not an add-on.

0–0%of active users create a report in a given month — roughly one in nine changed a habit
0%no longer creates a report manually
~0xhigher blended LTV than the rest of the base
Data from October 2025 – June 2026, from Localo's data analyst.

07 · Summary

Takeaways

Over the following weeks we watched how the new feature was adopted. I reviewed Clarity recordings to see how users handled reports. I checked support tickets for anything related to the feature. We gathered ideas for the next iterations and shipped some of them, including showing whether a report was sent directly, a link was generated, or a PDF.

I know that I know nothing

The most valuable part of this project was writing down the list of things we didn't know. The CEO's hypothesis failed because it rested on assumptions about people we'd never actually asked.

Technical doesn't mean later

Bringing engineers in at the concept stage, not at handoff, changed the shape of the product. Email client constraints weren't an implementation detail — they were a factor that defined what the report looks like.